Test Dashboard
A read-only view of how the tests you wrote in Test Manager have been running. Nothing is created or changed here.
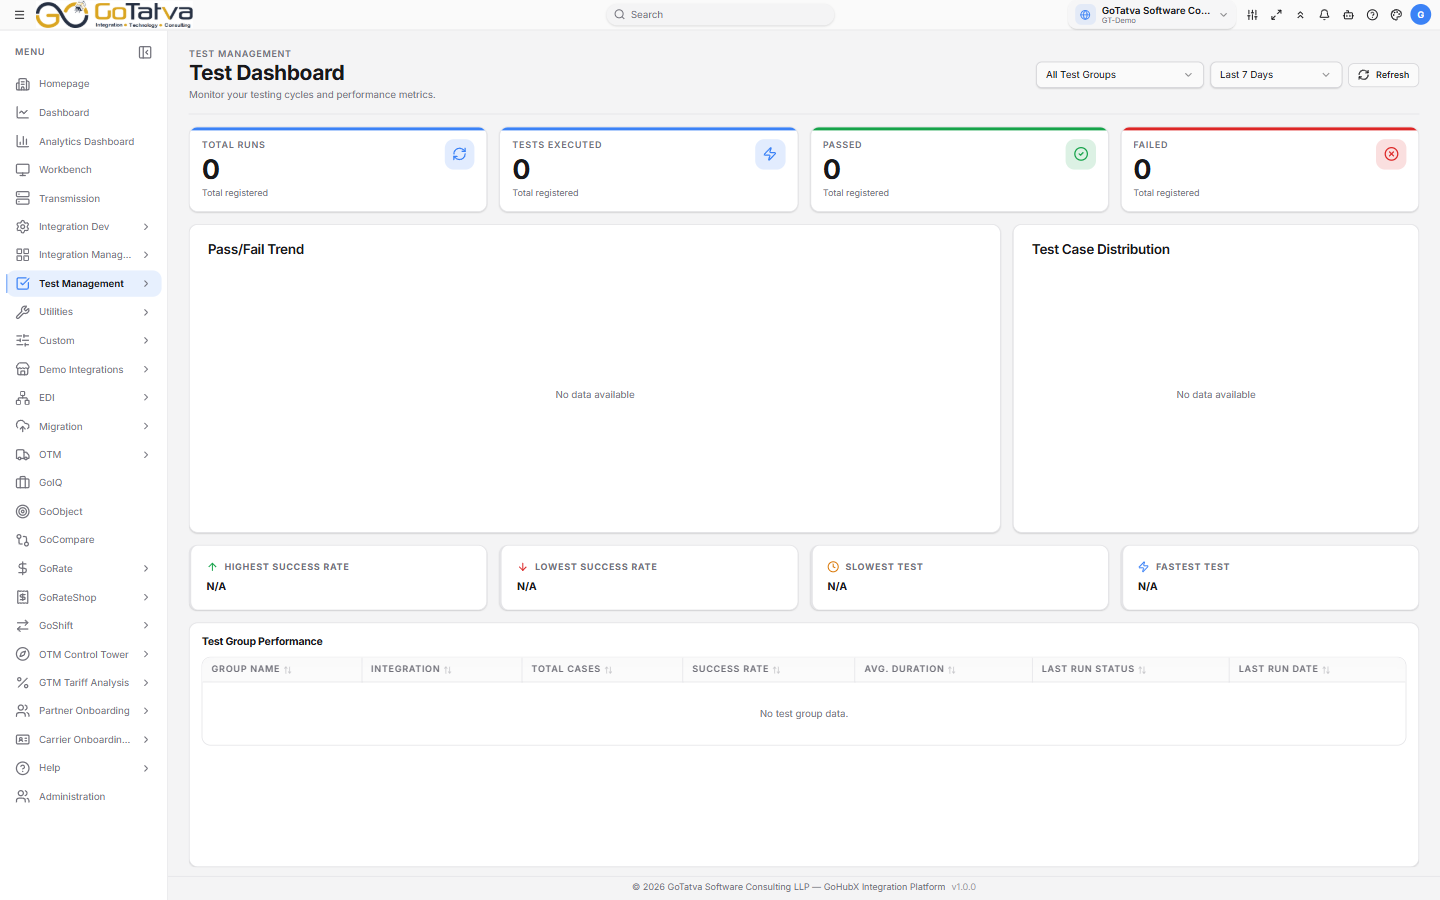
Four totals, two charts, four metrics and the per-group table.
Before you start
Pick the right project in the top bar. The dashboard reads the selected project only. With no project selected the page renders zeros everywhere without saying why, so check the top bar first if every tile is empty.
Choosing what to show
Three controls sit in the header:
| Control | Options |
|---|---|
| Select Test Group | All Test Groups, or one group |
| Select Period | Last 7 Days, Last 30 Days, Last 90 Days, Custom Range |
| Refresh | Reloads the group list and the figures |
Choosing Custom Range adds two date boxes. Neither can be set past today.
The four totals
Total Runs · Tests Executed · Passed · Failed — for the chosen group and period.
Charts
- Pass/Fail Trend — passed and failed counts over the period.
- Test Case Distribution — a breakdown into Passed, Failed, Error and Never Run.
Both read No data available when nothing ran in the period.
Performance metrics
Highest Success Rate · Lowest Success Rate · Slowest Test · Fastest Test. Each shows N/A when there is nothing to compare.
Test Group Performance
| Column | Notes |
|---|---|
| Group Name | |
| Integration | The integration the group tests |
| Total Cases | |
| Success Rate | A bar and a percentage |
| Avg. Duration | In milliseconds, or - |
| Last Run Status | PASSED, FAILED, PARTIAL_SUCCESS or NEVER_RUN |
| Last Run Date | Or - if it has never run |
Every column sorts. The success rate is coloured green at 90% or above, amber from 70%, red below that.
What this screen does not do
There is no export, no row click and no drill-down. To act on anything you see here, open the group in Test Manager.