Report
Build a pivot over an integration's transaction data and save it, so the same view can be opened again without rebuilding it.
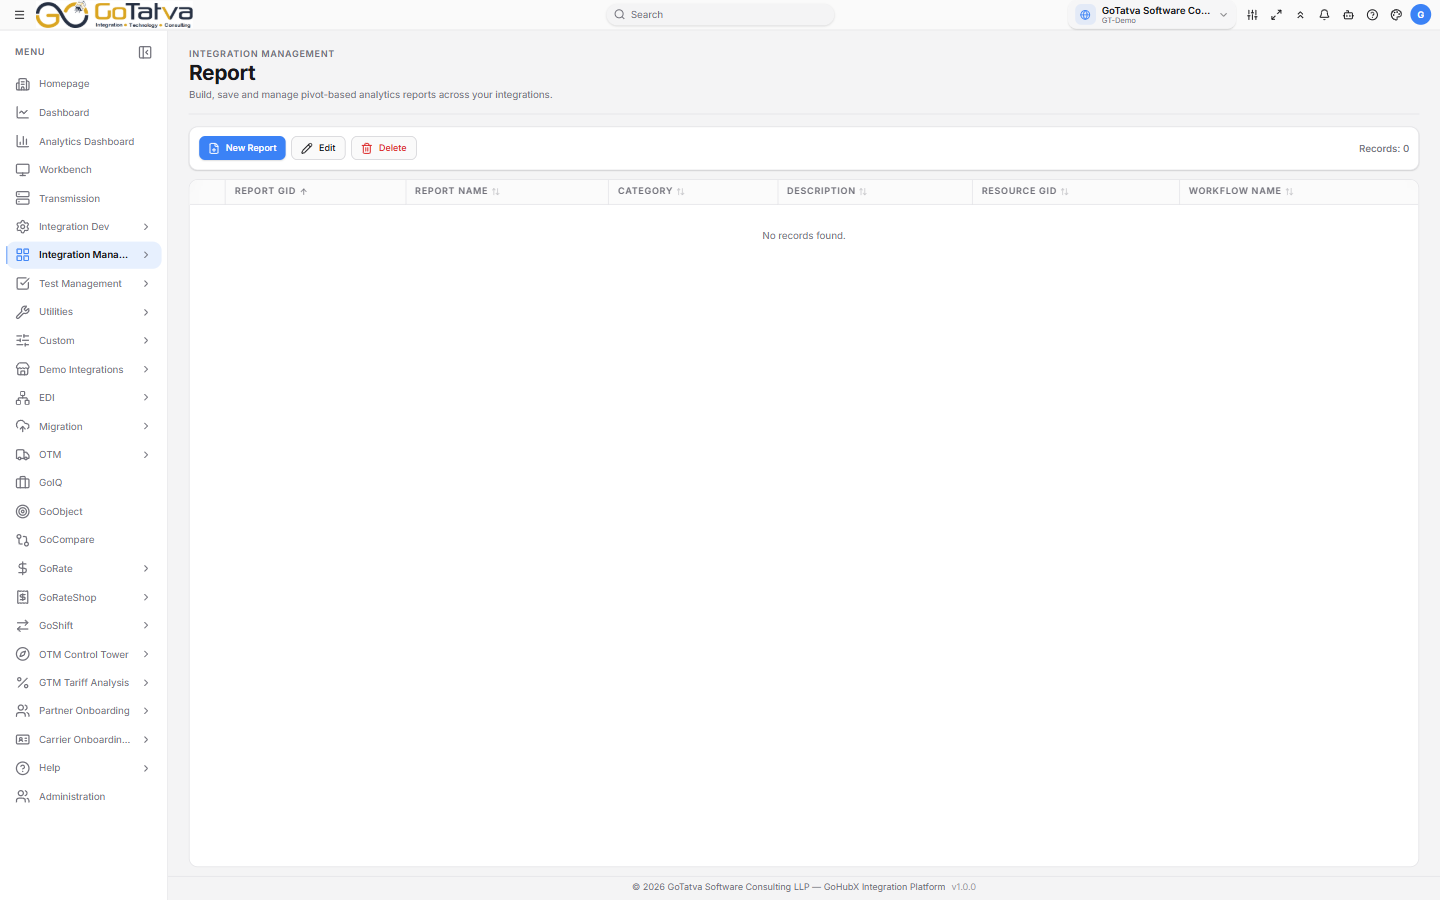
Saved reports, and the builder behind them.
Building one
New Report opens the builder. Pick the integration whose transactions you want, then drag the business ID fields into rows, columns and values to shape the pivot.
Save asks for:
| Field | Notes |
|---|---|
| Report Name | Fixed once saved |
| Category | How it is grouped in Analytics |
| Description | What the report is for |
| Icon | Chart, table, file, database or star |
The list
Report GID, Report Name, Category, Description, Resource GID and Workflow Name. Edit reopens the builder; Delete removes it.
If the pivot is empty
Please select an integration to view the report means no integration is chosen yet. No report data available for the selected integration means that integration has not produced transactions with business IDs - the pivot is built from those, so an integration that does not set them has nothing to show.
Analytics shows the figures as they were when the report was saved, not a live query. To refresh one, open it here and save it again.