Dashboard
The network overview. Open it first thing to see what is moving, what is late, and what needs attention today.
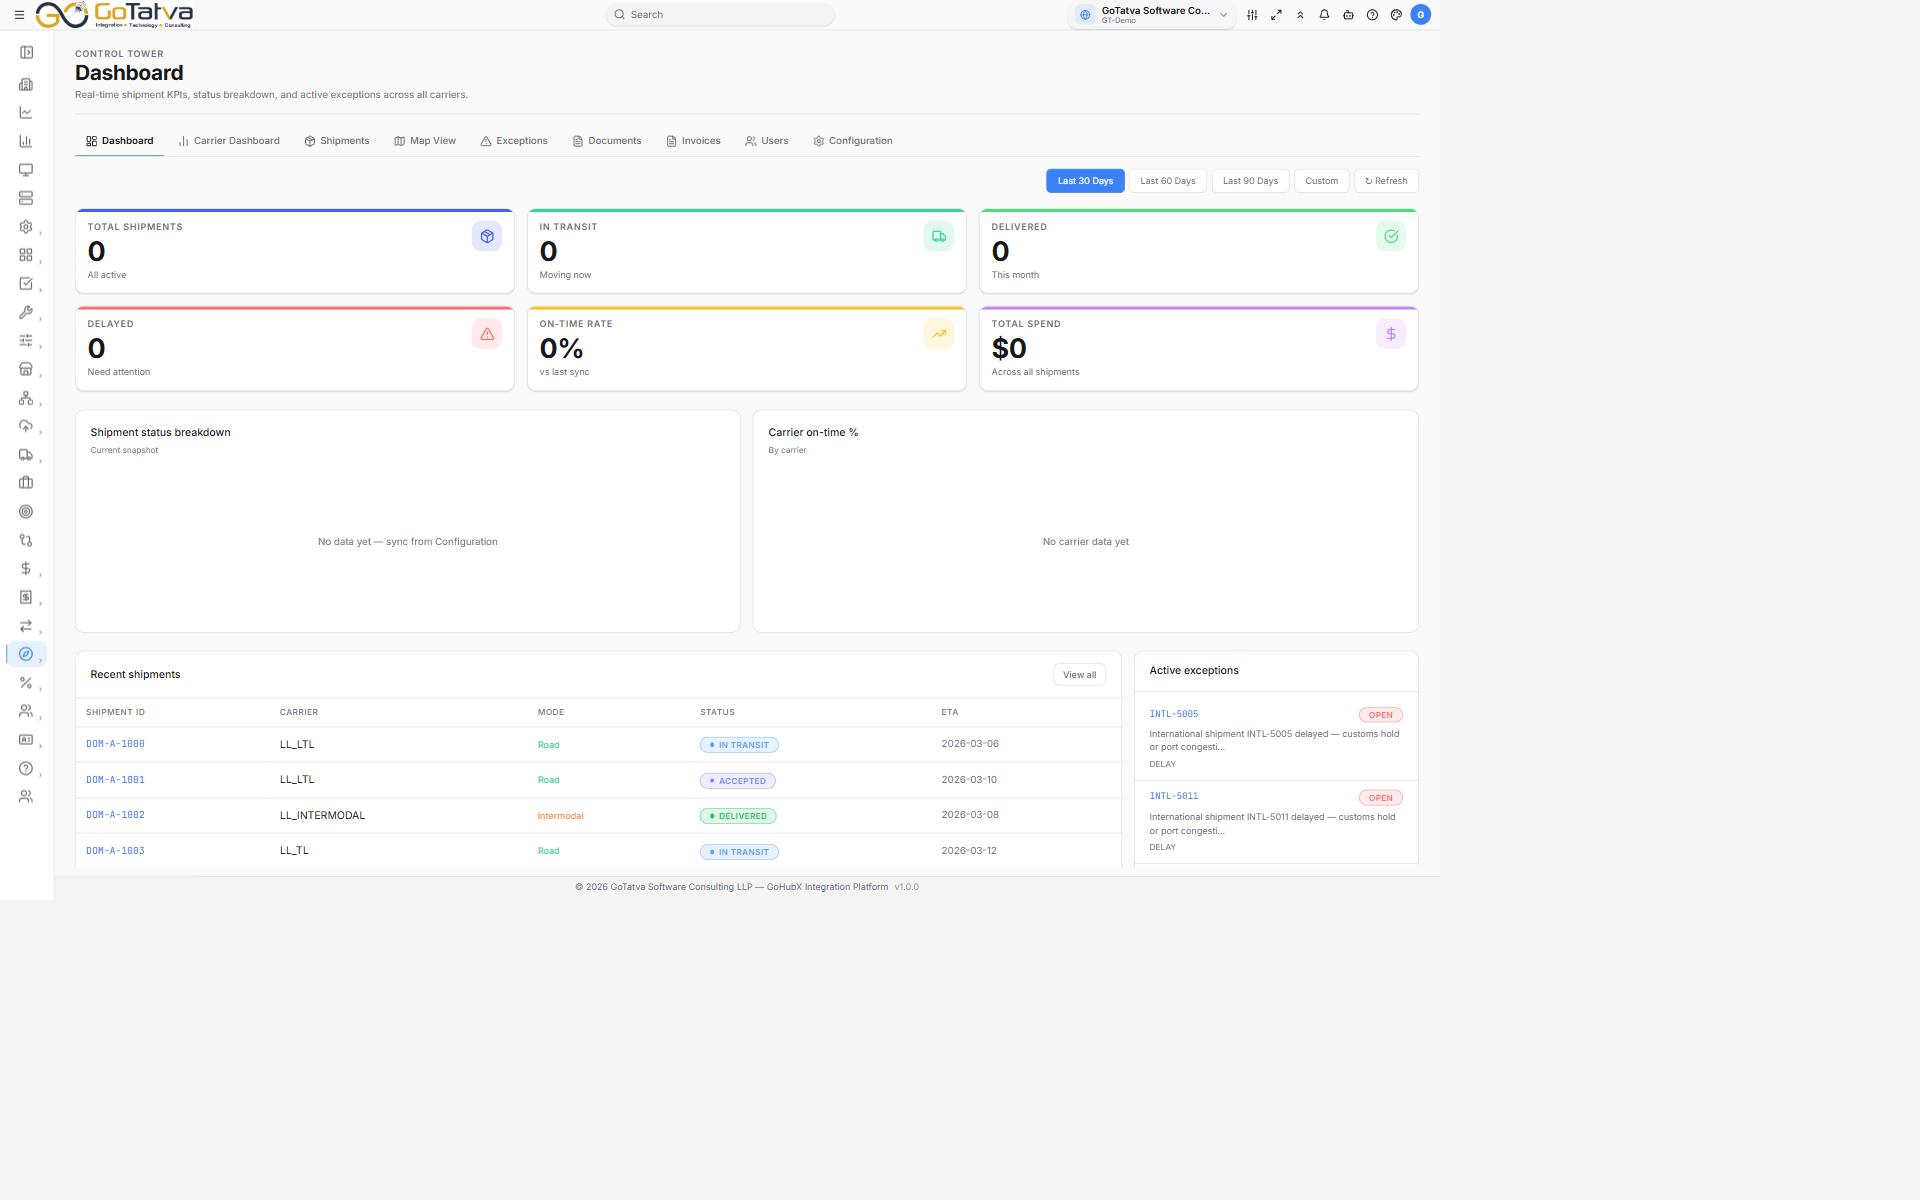
The Dashboard over the last 30 days.
Choosing the period
The time filter at the top right covers Last 30 Days, Last 60 Days, Last 90 Days and Custom. Custom gives you two date pickers - both have to be filled before the screen reloads. Refresh re-reads the data without changing the period.
The numbers
Six cards across the top:
| Card | Reads |
|---|---|
| Total Shipments | All active |
| In Transit | Moving now |
| Delivered | This month |
| Delayed | Need attention |
| On-Time Rate | vs last sync |
| Total Spend | Across all shipments |
A dash means the figure is not available - usually because no sync has run.
The charts
- Shipment status breakdown - the current snapshot, by status.
- Carrier on-time % - how each carrier is performing.
Hover any segment or bar for the exact figure.
Recent shipments
The five most recent, with Shipment ID, Carrier, Mode, Status and ETA. Click a row to open that shipment; View all takes you to the full Shipments list.
Active exceptions
The five open exceptions, newest first. Click any of them to go to the Exceptions screen and work the list.
When there is nothing outstanding this reads No active exceptions. - which is the state you want.